Ratings Roundup: ABC Nets Most-Watched NBA Finals Since 1998; NBC Scores Best Non-Original-Six Stanley Cup Final on Record
Story Highlights
Ratings roundup is a rundown of ratings news from the past week and is derived from press releases and reports around the industry. In this week’s edition, ABC notched the most-watched NBA Finals since 1998 (Michael Jordan’s last NBA Finals appearance), NBC’s 2017 Stanley Cup Final is the most-watched final on record without an Original Six team, Sportsnet’s Stanley Cup Playoffs audience was up 94% over last year, Univision’s USA/Mexico World Cup Qualifier on June 11 was the most-viewed soccer match on any network this year (regardless of language), and more.
ABC Nets Most-Watched NBA Finals Since 1998
The 2017 NBA Finals on ABC was the most-watched NBA Finals since 1998, when Michael Jordan’s Chicago Bulls made their last Finals appearance. The five-game series (Warriors 4-1 series win over the Cavs) averaged a total live audience (television plus streaming) of 20,840,000 average viewers, up slightly from 20,578,000 viewers for last year’s seven-game series. On television, the series averaged 20,406,000 plus an average minute streaming audience of 434,000 viewers. The Finals also averaged an 11.3 rating, down slightly from last year’s seven-game series (11.4) and down 3% from a 2015’s six-game series (11.6) – both of which featured the Warriors and Cavs.
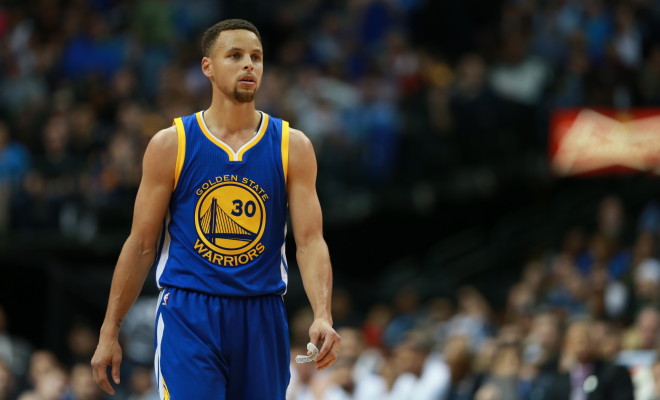 Monday’s Game 5 broadcast on ABC generated a total live audience of more than 25,003,000 average viewers, making it the most-watched Game 5 since 1998. It peaked with 29,525,000 viewers at 11:30 p.m. ET. The broadcast was up 20% from 20,908,000 for Game 5 in 2016. The audience included 24,466,000 average viewers (P2+) and an average minute streaming audience of 537,000 viewers (second-most streamed NBA game ever trailing only Game 7 last year).
The NBA Finals on ABC won the night across all of television for the 60th consecutive time. In the San Francisco-Oakland market, the Game 5 broadcast delivered a 39.6 metered market rating and in the Cleveland market it generated a 37.1 rating. The other top local markets include: Columbus (23.3); Sacramento (21.2); Atlanta (21.0); Miami (20.6); Memphis (20.1); Los Angeles (19.1); Chicago (18.6); Richmond (17.7). (ESPN/ABC)…
2017 Stanley Cup Final Is Most-Watched Final on Record Without an Original Six Team
The six-game 2017 Stanley Cup Final produced a Total Audience Delivery (TAD) of 4.762 million average viewers, making it the most-watched Stanley Cup Final on record without an Original Six team (according to Nielsen Fast Nationals and Adobe Analytics).
The Pittsburgh Penguins Championship-clinching Game 6 victory over the Predators on NBC (one June 11) averaged a TAD of 7.086 million viewers, up 29% vs. last year’s Cup-clinching Game 6 on NBC featuring Pittsburgh and San Jose (5.476 million).
Across all 84 games on NBC/NBCSN/CNBC/USA Network, the 2017 Stanley Cup Playoffs averaged a TAD of 1.387 million viewers, up 11% vs. 2016, despite five Canadian teams in this year’s Playoffs vs. zero last year. It is the ninth consecutive year that the Playoffs have averaged more than 1.2 million viewers.
The 2017 Stanley Cup Playoffs on NBCSports.com and the NBC Sports app were the most-streamed in history. The 2017 Stanley Cup Playoffs delivered more than a half-billion live minutes (527.4 million) and two million uniques, up 31% and 22% vs. the 2016 Stanley Cup Playoffs.
Despite neither Nashville (#29) nor Pittsburgh (#23) being a Top 20 TV market, the 2017 Stanley Cup Final on NBC/NBCSN averaged 4.762 million viewers, making it the most-watched Final on record without an Original Six team (Boston, Chicago, Detroit, Montreal, N.Y. Rangers, and Toronto). Viewership was up 19% vs. the 2016 Stanley Cup Final, which featured the Penguins and the San Jose Sharks. The 2017 Stanley Cup Final averaged a 2.67 HH rating across the six games on NBC/NBCSN, and the TV-only viewership averaged 4.679 million viewers, up 18% and 19%, respectively, vs. the six-game 2016 Final.
Locally, the 2017 Stanley Cup Final averaged a 32.0 rating in Pittsburgh on NBC/NBCSN, up from the market’s 31.7 average during the 2016 Penguins-Sharks Stanley Cup Final. Nashville shattered ratings records throughout the playoffs, and averaged a 22.0 in the Stanley Cup Final. Digitally, Pittsburgh and Nashville delivered the most-streamed Stanley Cup Final ever, totaling 760,000 uniques and 97.7 million live minutes, up 38% and 45%, respectively, vs. last year’s Cup Final.
Game 6 averaged a TAD of 7.086 million viewers, up 29% vs last year’s Game 6. It is only the seventh Stanley Cup Final game to exceed seven million average viewers, and the sixth on NBC. TV-only viewership delivered a 3.88 HH rating and 6.985 million average viewers, up 26% and 29%, respectively, vs. 2016. TV-only viewership peaked with nearly 9.5 million viewers in the 10:45–11 p.m. ET quarter hour (9.406 million), as Pittsburgh broke a scoreless tie late in regulation. When final ratings are released, NBC is expected to win the night in the advertiser coveted Adult 18-49 demographic. Game 6 registered a 40.0 rating in Pittsburgh, to rank as the second-highest rated Penguins game ever in the Pittsburgh market on the networks of NBC, trailing only Game 7 of the 2009 Stanley Cup Final (42.2). The game also delivered a 28.3 rating in Nashville to rank as the highest-rated Predators game ever in the market on the networks of NBC. All six Stanley Cup Final games were the highest-rated Preds games ever in the market. In addition, three Tennessee markets (Nashville, Knoxville, and Memphis) ranked in the Top 10 markets for Game 6; Knoxville ranked third with a 10.7 rating, while Memphis tied for ninth with a 5.4 rating. Digitally, Game 6 delivered an Average Minute Audience of 101,000 viewers, the highest-ever for an NHL game, and up 47% vs. last year. Game 6 produced the third-most live minutes (19.5 million) and fourth-most uniques (266,000) ever for an NHL game, which were up 63% and 41%, respectively, vs. 2016. (NBC Sports Group)…
Up North, Stanley Cup Playoffs Audience Up 94% Over Last Year for Sportsnet
In Canada, Sportsnet’s audiences for television, digital and radio coverage all increased significantly year-over-year for the Stanley Cup Playoffs. With five Canadian teams making the playoffs this year and the Ottawa Senators reaching the Eastern Conference Finals, the Stanley Cup Playoffs was the #1 show on television in Canada for 42 of the 46 nights that hockey was broadcast this post-season. The playoffs delivered an overall average minute audience of 1.61 million Canadians – up 94% over the same time last year.
This year’s Stanley Cup Final between Pittsburgh and Nashville had an average minute audience of 2.67 million, which is 18% higher than 2016. Overall, the playoffs reached 26 million viewers – nearly three-quarters of all Canadians. 24 billion minutes of hockey were watched through the course of the playoffs – up 88% versus 2016.
Game 7 of the Eastern Conference Final between the Ottawa Senators and Pittsburgh Penguins was the most watched game of the playoffs with an average of 4.29 million viewers.
On the digital side, Sportsnet digital properties grew to 4.49 million unique visitors in April – an increase of 37% vs. April 2016. This is the highest month ever in Sportsnet’s history. Visits to Sportsnet.ca increased 16% versus the same time last year with page views also up 22%. Unique visitors to the Sportsnet App increased 56% year-over-year. Sportsnet NOW unique visitors increased year-over-year for each round of the playoffs and a total of 66% overall. Live streams were up 164% from this time last year. Unique visitors to Rogers NHL GameCentre LIVE increased overall by 61%, with total streams started up 68% for the entirety of the playoffs. (Sportsnet)…
Univision’s USA/Mexico World Cup Qualifier Is Most-Viewed Soccer Match of Year
Univision’s coverage of the much-anticipated USA/Mexico World Cup Qualifier on June 11 was the most-viewed soccer match on any network this year, regardless of language. The match averaged 4.5 million Total Viewers 2+ and 2.5 million Adults 18-49 who watched the World Cup Qualifier on Univision, with a simulcast on UDN. However, that was down 2% from the sides’ previous World Cup qualifier in November (4.6M) and down 12% from their matchup in the 2015 CONCACAF Cup (5.1M), according to SMW.
Ending in a 1-1 draw, the Mexico-USA World Cup Qualifier bested FS1’s delivery of the same match by +96% among Total Viewers 2+ and +89% among Adults 18-49, and drew in a larger Hispanic audience than the first four NBA Finals games. Additionally, this was the top World Cup Qualifier match in any language on any network in over four years, since March 26, 2013…
…Over on Fox Sports 1, English language coverage of the USA/Mexico matchup attracted 2,052,000 viewers on FS1, making it the most-watched World Cup Qualifier in the network’s history. It also delivered a 1.1 final rating and up 57% and 63% from the November match (0.7) and up 38% from the 2015 contest (0.8), per SMW. (Fox Sports)…
Ratings Odds and Ends: Belmont Stakes, NHRA, Finals on NBA TV, and Outdoor Channel
The race portion of The Belmont Stakes earned a 3.2 final rating and 4.9 million viewers on NBC Saturday evening, down 14% in ratings and 16% in viewership from last year (3.7, 5.8M) and down 29% and 30% respectively from 2013 (4.5, 7.0M), the last two times there was no Triple Crown at stake. Taprwit‘s win was the lowest rated and least-watched Belmont since 2010 on ABC (3.0, 4.7M). (SMW)…
…Airing immediately after NASCAR Cup Series coverage, taped NHRA eliminations from New Jersey earned a 1.0 final rating and 1.6 million viewers on Fox Sports 1 Sunday afternoon, up 43% in ratings and 52% in viewership from last year (0.7, 1.1M) and the largest NHRA audience on record (dates back to 2002). (SMW)…
…NBA TV scored an all-time best of 270,000 average viewers for its postgame coverage of this year’s NBA Finals, marking an uptick of 5% over last year’s comparable coverage. Overall, viewership for the network was up 15% during primetime for this year’s NBA Playoffs, with gains across all key demos over 2016 numbers. (Cynopsis Sports)…
…Outdoor Channel continues to be the No. 1 top-growing basic cable network with Adults 18-34 (up +103%) and Men 18-34 (up +67%) during Total Day in the first quarter of 2017 compared to one year ago. During Q1 2017, Outdoor Channel grew its coverage ratings during Total Day with Persons 2+ (+1%), Men 18-34 (+67%), Adults 18-34 (+103%) and Adults 18-49 (+5%) from a year ago. The outdoor lifestyle network delivered its highest first quarter ratings in seven years (1Q2011 to 1Q2017) during total day with Adults 18-34 and Men 18-34. (Outdoor Channel)