NHL Deploys Analytics-Powered Graphics for Puck/Player Tracking in Live Broadcast
League introduced shot and save analytics during 2021 Stanley Cup Playoffs
Story Highlights
A new NHL season is off and running, and, with two new national broadcast rightsholders in the U.S., the league is entering a new era in broadcasting. One of the most notable advances this season is already being deployed for the live broadcast: a more aggressive and comprehensive use of analytics data through real-time graphics.
Both ESPN and Turner Sports have expressed a desire to improve use of the maturing NHL EDGE puck- and player-tracking system. Instant graphics showing shot speeds, shift times, and IDs of players on the ice use tracking data to easily automate (or simplify) integration of those key storytelling elements into the display. The league, through its partnership with AWS and graphics developer SMT, is investing more resources and effort into refining those services and delivering actionable data, graphics templates, and overlays for use in the live broadcast. The key concept there: live.
“A rationale for that was to figure out how we could truly enhance the presentation of the live game,” says Dave Lehanski, EVP, business development and innovation, NHL. “Hockey’s a fast game. It moves really fast, but it also plays really fast: there are very few stoppages. One of our challenges is to tell stories about what’s happening on the ice with the players, the coaches, the decisions being made, the skill and the speed of players when there’s just not a lot of time to do it. We realized not too long ago, if we were to do anything, we need to be able to do it as an overlay or an integration into the live game.”
MORE: NHL SVP, Technology Grant Nodine on an ‘Amazing Ecosystem’ of Data, Video
Two stats that the NHL and AWS have emphasized are “shot analytics” and “save analytics.” Both stats, which debuted during the 2021 Stanley Cup Playoffs, are intended to tell a better story of individual and team performances and where either (or both) might be finding success.
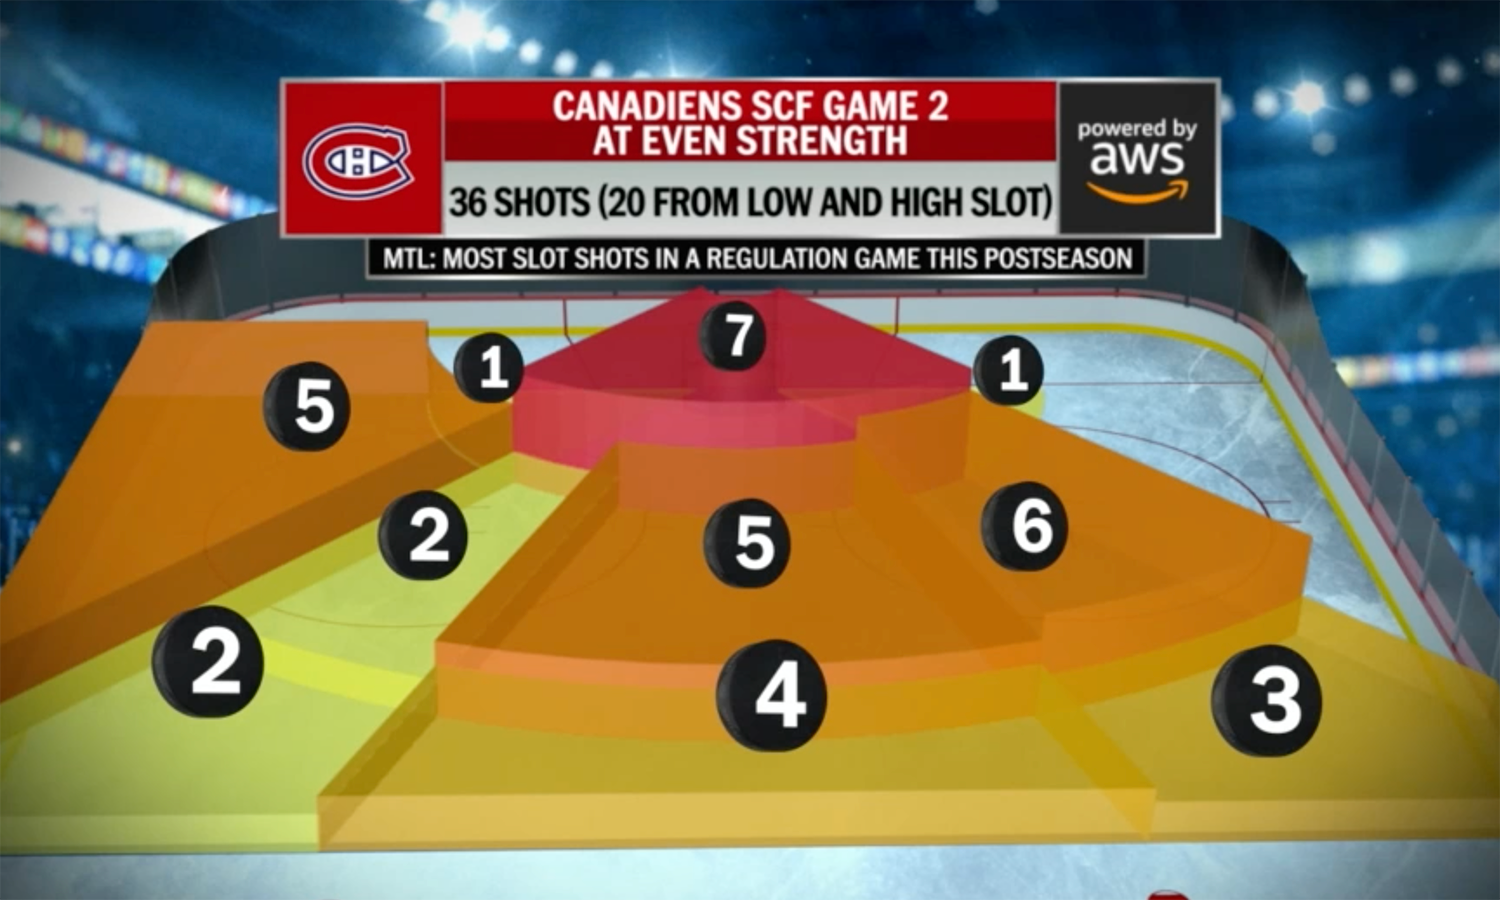
The NHL debuted shot analytics and save analytics during the 2021 Stanley Cup Playoffs. This graphic showed the shot analytics of the Montreal Canadiens during Game 2 of the Stanley Cup FInal. Although Montreal generated many scoring opportunities at even strength, they lost this game to the eventual champion Tampa Bay Lightning.
Shot analytics enable the graphics to reveal how shot opportunities are created and converted into goals from different locations on the ice. Elements are designed by the league to showcase how teams and players perform in various positions on the ice in everything from even-strength scenarios to power plays and short-handed situations.
“[What we] start to get fans to understand,” says Lehanski, “is [what] places on the ice that goals are scored from and what sets certain players apart from others with regard to the ability to score either more often in those areas or from more areas on the ice. That’s a graphical overlay that our broadcasters are going to start to integrate quickly.”
Save analytics, meanwhile, basically flip the script on the same data set: how does a goalie perform based on shots fired from various positions in the offensive zone. Save analytics calculate and display goaltenders’ save percentages from various zones on the rink and can drill down to unique and illuminating situations, such as if a key defensive player is missing during a power play or an odd-man rush is headed the goalie’s way.
“We use the same zoning chart so there’s consistency with regard to how we break the offensive zone of the ice into different zones,” notes Lehanski. “The same analytics will calculate and visualize goaltender save percentages and the volume of shots they stop from each of those zones. Then we layer in some of the context of the score of the game. How does this look in a one-goal game for certain goalies? How does this look in the last two minutes of a one-goal game? You can apply some of the contextual relevance and start to tell these stories using graphics and visualizations in real time that we were never able to do before.”

NHL’s Dave Lehanski: “Hockey’s a really fast game. We realized not too long ago, if we were to do anything, we need to be able to do it as an overlay or an integration into the live game.”
The NHL EDGE puck- and player-tracking system was developed closely in tandem with SMT. Most recently, the league has installed four 4K cameras in each of its 31 arenas. Two are positioned directly under the centerhung videoboards to provide a complete look at the offensive zone for sustained possessions in the zone, power plays, shootouts, etc. The other two are high up in the ends of each building, offering a view of the entire ice surface — a view preferred by coaches and other team-performance personnel.
Although the tracking system can essentially plot out its own charts and data sets, Lehanski says, the cameras are an essential part of the complete workflow.
“That’s really when the magic happens,” he explains, “when you have the data in the video together. It’s overlays with highlights combined together. Whether you’re searching for the data or searching for the video, you’re going to get both and think of the application. Then, all the AI and ML applications for that video and that data start developing predictive analytics and all the wonderful, magical stuff that comes with them.”
The league is also working to continue to grow its pool of available data, refining elements to tell the story of faceoff matchups, distance traveled by players during a shot/game, and much more — all while growing data to be used in a more predictive sense.
The season is young, and Lehanski stresses that this is a growing process, one that he hopes will continue to develop products that entice more broadcasters of live coverage to stock in their arsenal of storytelling tools.
“I think it’s going to take some time,” he says, “but, yes, you will start to see this in various forms. There’s a deep, deep AI, ML, AWS high-performance computing layer to this massive project that’s going to touch every aspect of the NHL. Fans, media partners, coaches, players, you name it. [Our goal] is to ultimately deliver more new content that’s born from the data and the video that we’re processing with AWS. It’s really, really exciting.”