
SVG Tech Insight: Creating Schedule-Adjusted Metrics in NCAA Basketball for Differentiating Content, More Accurate Team Evaluation
This fall SVG will be presenting a series of White Papers covering the latest advancements and trends in sports-production technology. The full series of SVG’s Tech Insight White Papers can be found in the SVG Fall SportsTech Journal HERE.
Introduction
Evaluating teams in college sports properly requires going beyond win-loss records and basic stats, as the level of competition each team faced in achieving those results should be taken into account. In NCAA Division I basketball, more than 350 men’s and women’s teams play schedules of highly varying quality, both in and out of their conferences.
Fairly evaluating teams is not just important to create better stats and answer basketball-relevant questions (e.g. which are the best offenses?), but the idea is crucial to the NCAA Tournament selection and seeding process. Both the men’s and women’s tournament fields are chosen by basketball committees made up of various executives within the NCAA basketball community. The process involves many different pieces of data collected on each team: multiple team rankings, measures of strength of schedule, counts of opponents played and defeated by difficulty, and more. Enabling team power ratings and rankings to properly account for the differing schedule contexts for team performance results in a more realistic and accurate evaluation process.
Raw vs Adjusted Statistics
A “raw” team stat is generally an aggregate calculation based on a team’s performance over all its games (e.g. offensive efficiency), which can be measured across all teams to generate a “raw” ranking. But should a team with a great raw offensive efficiency rank very highly if they play many of the weakest defensive teams in the country? How a team performed in isolation isn’t as valuable without also knowing against whom those performances took place (and where).
Advanced team stats like efficiency, pace, and the Four Factors exist publicly for NCAA men’s basketball on websites like KenPom, Sports Reference, and TeamRankings, but some of those stats aren’t always adjusted for schedule. Also, sites like those rarely include women’s basketball stats. As part of its partnership with the NCAA, Google Cloud developed a system to adjust various important basketball team metrics for schedule, taking into account each team’s opponent and location (home, road, or neutral) in every game.
Schedule Adjustment Method
The schedule adjustment method uses ridge regression (a statistical/machine learning technique) to adjust each team’s performance based on quality of opponent on the other side of the ball (e.g. team offense is adjusted for opponent defense). The main idea is that each stat of interest is a function of three things: a team’s ability, their opponent’s ability (on the “other side” of that stat), and home-court advantage. Using a very loose model representation:
game_stat ~ intercept + tm_effect + opp_effect + home_advantage + (error)
A separate model was fit for each statistic (e.g. 1 for pace, 1 for effective FG%, etc.), with the model’s input data including the stat value from every game in a specific season, across all teams and opponents. The ridge regression model was fit using Python’s scikit-learn package, with the resulting regression coefficients representing team effect, opponent effect, and home advantage estimates. In other words, the regression automatically does the opponent and site adjustment and produces adjusted team stats.
Ridge regression is a particularly good fit for this use case to help handle multicollinearity and “shrink” coefficients (particularly in small sample size cases) — a form of regularization that gives more sensible estimates. This is a much more thorough and statistically valid technique than your typical “stat vs. opponent season average” adjustment that is often found in other such analysis, with the additional advantage of site adjustment.
In the basketball context, the concept behind how a team’s stat gets adjusted is fairly logical: playing higher quality opponents and doing so away from home generally results in a team’s statistics being boosted by adjustment; playing lesser opponents and more home games in general leads to a negative adjustment. For example, if a team’s defense often holds opposing offenses below their usual efficiency, then it will likely rate as a good defense after adjusting for schedule.
Effect of Adjustment on Team Statistics
To see how adjusting for schedule can impact the measurement and ranking of teams in a particular statistic, consider the following plot. It shows each 2018-19 men’s Division I basketball team’s raw and adjusted version of net efficiency — net points per 100 possessions, a pace-adjusted version of scoring margin — a couple days before Selection Sunday. Raw net efficiency is on the x-axis, adjusted net efficiency is on the y-axis (up and right is good), with each team represented by a single point.
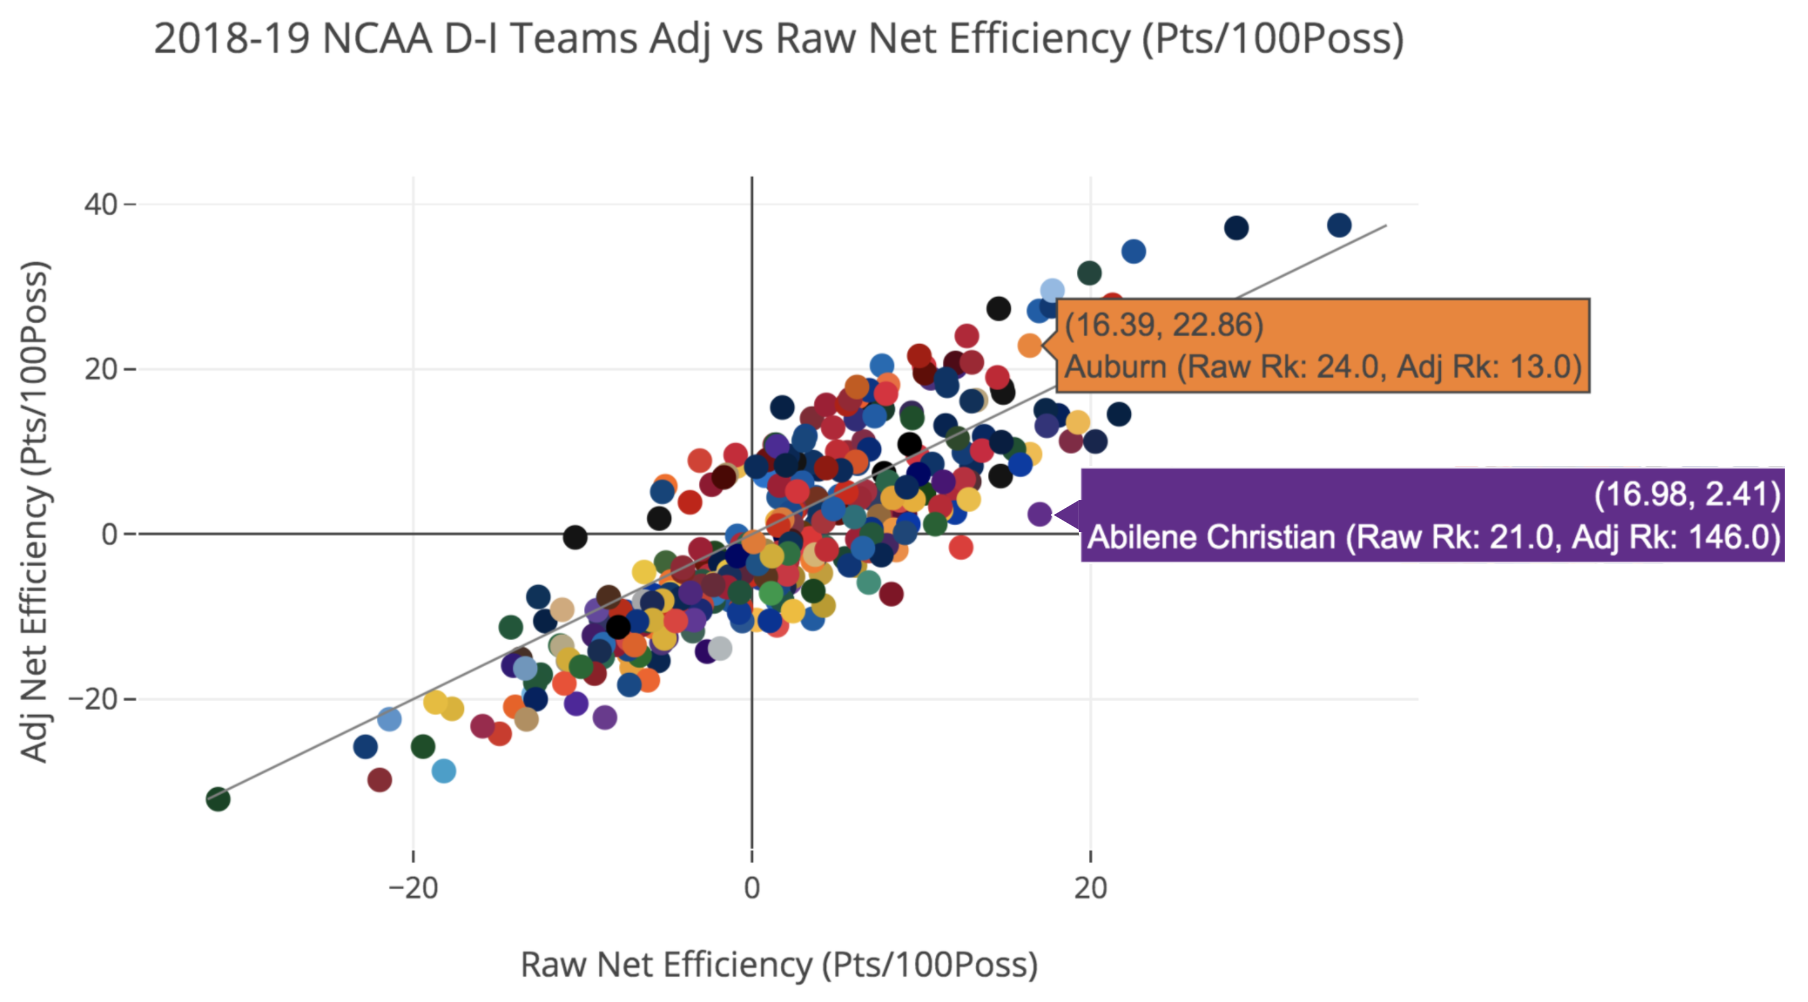
2018-19 NCAA Men’s Division I Basketball Teams Adjusted vs Raw Net Efficiency (Through March 11)
Most points fall relatively close to the diagonal gray line, where raw and adjusted efficiency would be equal. But some teams have adjusted efficiency values and rankings that are rather different from their raw ones, which suggests their competition has a substantial effect on the way they look.
Take the two teams highlighted on the plot: Abilene Christian (ACU), ranked 21st in raw net efficiency, and Auburn, slightly behind at 24th. While ACU performed well that season, playing a relatively weak Southland Conference and non-conference schedule dropped them all the way to 146th after adjusting for schedule. Meanwhile, adjusting for Auburn’s strong Southeastern Conference and non-conference slate of opponents boosted their efficiency and their ranking up to 13th — well ahead of ACU.
This is schedule-adjusting doing its job, as the teams’ similar raw efficiency numbers belie the fact that Auburn’s results were much more difficult to achieve. Most informed college basketball observers would have rated Auburn well ahead of Abilene Christian at that time, with the NCAA committee giving a ACU a 15-seed and Auburn a 5-seed in the 2019 NCAA Tournament. The adjusted net efficiency was much more reflective of tournament performance, too, as ACU lost by 35 to Kentucky in its first game, while Auburn defeated some really strong teams (including Kentucky) on the way to the Final Four.
Predictive Value of Adjusted Net Efficiency
The preceding example illustrates the predictive value of adjusting net efficiency for schedule across teams. A much more comprehensive study of the predictive value of using schedule-adjusted net efficiency as a power rating across late-season games, including NCAA Tournament contests, shows that it is quite predictive of future performance for both men’s and women’s basketball.
Details of that more thorough evaluation are beyond the scope of this paper, but the table below helps demonstrate this with a specific example. The table shows each of the eventual Sweet 16 women’s basketball teams for the 2018-19 season, with their rankings in raw and adjusted efficiency (along with the rank difference) from the day the NCAA Tournament field was selected (i.e. before any Tournament games).
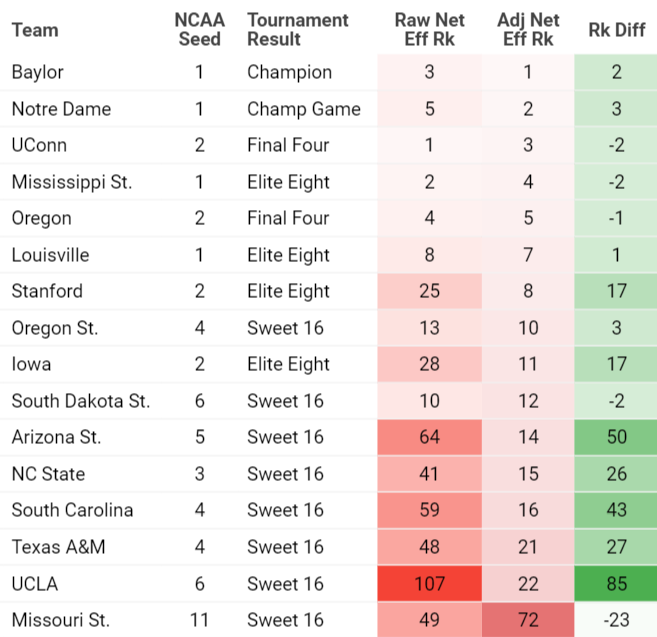
2018-19 NCAA Women’s Division I Basketball Sweet 16 Teams Raw and Adjusted Net Efficiency Ranks (as of Tournament Selection Date)
Note that 14 of the top 16 teams in adjusted net efficiency made it to the Tournament’s second week, compared to only eight of the top 16 in raw efficiency. And while the top teams rated very highly in both metrics, seven eventual Sweet 16 teams ranked more than 15 spots better in adjusted net efficiency (UCLA is a particularly large outlier, ranking 107th in raw efficiency). This is a small sample, but is reflective of the greater trend across many more years and games.
In part because of this predictive value demonstrated over several years of analysis, adjusted net efficiency is a primary factor in the new versions of the NCAA Evaluation Tool (NET) recently adopted by both the NCAA men’s and women’s basketball committees.
Extensions and Further Discussion
The Google Cloud schedule adjustment methodology and implementation across multiple statistics allows for much more accurate team evaluation, both overall and in a number of specific facets of the game. These metrics can be used in differentiating and insightful storytelling for college basketball fans and analysts alike. Google Cloud used some of them in notes and other content elements across media platforms during the 2019 men’s NCAA Tournament, including on Tournament studio and game broadcasts viewed by millions.
In 2019-20, these schedule-adjusted metrics were calculated daily for every men’s and women’s basketball team the past six seasons, resulting in more than seven million rows of adjusted team stats available for all sorts of interesting analysis. This methodology was also extended to some advanced player statistics, allowing the creation of unique “all-in-one” player metrics that account for competition faced. Many of these results are found in the only public-facing dashboard with schedule-adjusted men’s and women’s metrics like these. While not in the scope of this paper, Google Cloud data analytics tools including Dataflow, BigQuery, and Cloud Composer were critical in the ingestion, data warehousing, computations, and orchestration necessary to calculate metrics at this scale on a regularly scheduled basis.
More broadly, the idea of adjusting metrics for schedule is fairly fundamental in sports analytics, especially in college but also in many professional sports, too. Having better metrics for team and player quality has many other implications in sports broadcasting, including deciding which games to schedule or teams to cover. In this way, putting this type of methodology and implementation into play can help make sports production and content smarter, more accurate, and more insightful.