SVG Sit-Down: Stats Perform’s Brian Orefice on How Player Tracking With AI, Remote-Based Technology Is Possible
The company’s AutoStats solution is having a big impact this college-hoops season
Story Highlights
Over the past decade, player tracking has become ubiquitous across major sports in the U.S. The hard work and technology behind those systems have ushered in a new era of not just smarter statistics for coaches and players but deep reservoirs of graphical data for live sports broadcasting.
 Player (and ball) tracking typically requires a complex infrastructure at stadiums and arenas. However, Stats Perform has been finding success with its newest solution, AutoStats, in enabling remote player tracking with the assistance of AI. It essentially makes it possible to “track” a game from anywhere without any hardware in the venue.
AutoStats has found success for some NBA teams on the coaching side and is making waves for broadcasters in college basketball. SVG sat down with Brian Orefice, VP, product, U.S. sports, Stats Perform, to get a better understanding of the solution, how it’s migrating to broadcast, and what’s next for the technology.
How does AutoStats work? What do you provide, and how is it sourced?
The idea of AutoStats is easy to grasp, although the concept belies its complexity behind the scenes. Simply put, it’s a broadcast-based tracking solution. Essentially, leveraging our expertise with computer vision and AI, we are able to create outputs that are similar to extremely costly in-venue camera/server systems but [don’t come with] the hassle and expense of stadium installations and hardware maintenance.
Our only requirement: standard broadcast video. We run that video through a CV process that automatically tracks all the players and calibrates their position from the screen to the court. From there, we sync it with our play-by-play event data and use positional modeling to automatically determine events like isolations, drives, post-ups, and screens.
 When armed with good tracking data, you’re limited only by your imagination as to what you want to analyze. Contested vs. uncontested shots? Catch-and-shoot vs. off-the-dribble? Rebounding-crash percentages? And that’s to stay nothing of metrics that can be surfaced on defense, where typical quantitative statistics really fall short.
How challenging is it to expand an analytics service initially designed and used for scouting and make it something that the average fan would find engaging and entertaining? What stats or deep analytics have you found to be valuable in parsing?
When we initially pitched ideas to broadcasters and their social teams, the initial feedback was that we were coming in with concepts too advanced for the average fan. For a broadcast in particular, you get only 20-30 seconds to make your point and move on. It’s critical that the point is organic to the moment and drives storytelling. We often found ourselves balancing the lure of pushing advanced and differentiated data with the requirement that those insights needed to be digestible.
Perhaps our most successful happy medium was the use of heat maps, which harnessed the power of raw data with sleek visualization. The most obvious difference between standard event data and tracking data is knowing the x/y coordinates of players. We took that information and created various heat maps that are quite insightful, like showing where a player is over the course of a game or season when he or she has the ball. Getting creative with relatively simple concepts leveraging data that has not been collected before — what’s the average shot-clock time before a team shoots, what percentage of passes led to a basket, how long does a player hold the ball for before shooting or passing? — solves the broadcast use case.
In your initial trials of expanding the service, what obstacles did the development team need to overcome? How were they overcome?
As with any technical innovation, being able to ultimately operate efficiently, accurately, and at scale is the key to long-term success. The company made a very deliberate pivot to technology-based solutions after being acquired by Vista, but it required a lot of work to get to where we are now.
Basic things like producing flexible but reliable court-calibration models, improving our automated player tracks to more seamlessly handle visual occlusions, and evolving our proprietary tooling so we could better operationalize our pipeline have been critical. You need a lot of data to create good models, and a ton of elbow grease went into that, particularly early on, when we were starting from scratch.
It helps that we’ve worked closely throughout with the Orlando Magic, who have been with us since the beginning of AutoStats. They’ve been a great partner, helped us create event definitions, and have put our data through the ringer for half a decade now as an integral part of their scouting process. They’ve also pushed us to expand our coverage from strictly college games to over 15 different leagues/competitions. Given the various court markings and rules sets, that presented some initial challenges, but we had a strong foundation in place — and learned a lot of lessons as part of the initial build-up — so we had a pretty good idea what we had to do to broaden the offering.
How do you see sports storytelling evolving, and what role does advanced data play?
Data for data’s sake is just noise. Storytelling is the true key to engagement. But, if done right, what better way to tell a story — particularly a sports story — than with numbers?
Advanced data offers so much more context and precision than traditional data, and the number of stories and insights you can unlock are exponentially multiplied. It’s just a matter of time before it becomes table stakes for broadcasters, who have been slow-rolling that type of content into their programming. I think the average basketball fan is a lot smarter than broadcasters give them credit for.
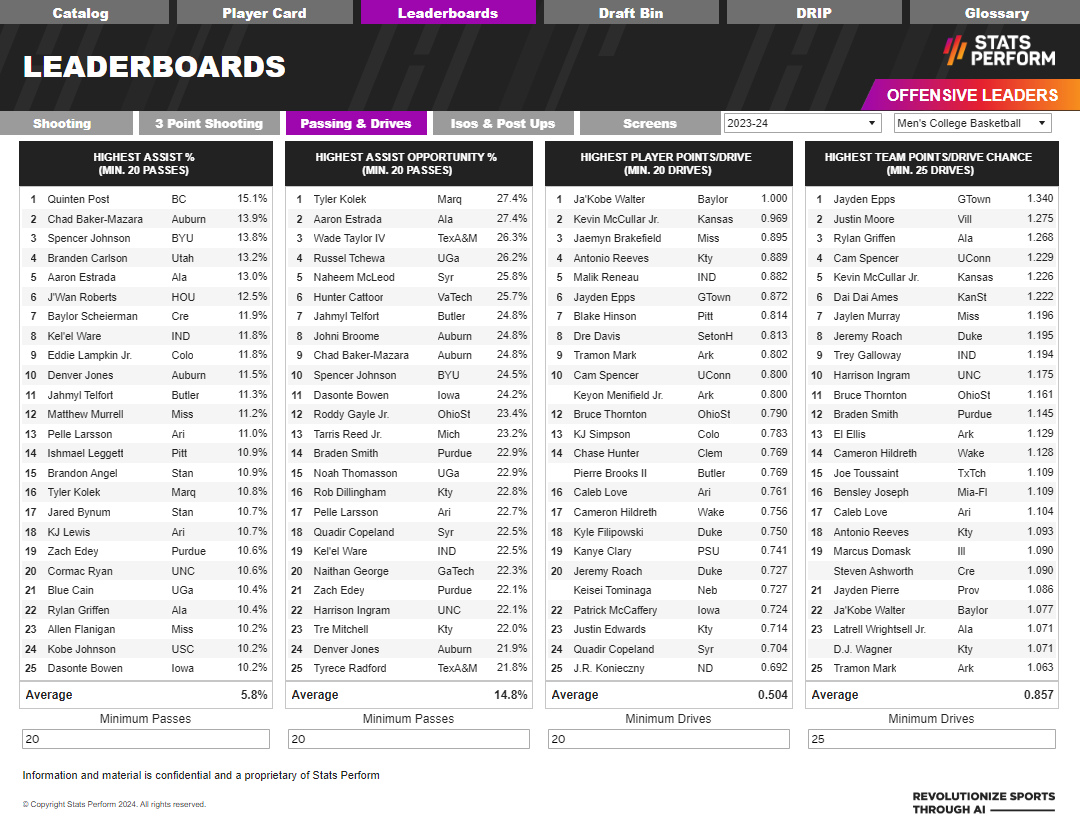
The valued demographic of viewers has grown up with technology, and sports fans in particular are passionate about statistics. If you tune into a normal NFL game, the color commentator routinely talks about offensive routes, defensive schemes, and secondary coverages in coaching jargon. We’d love to be part of the evolution of that discourse for basketball. If fans know what Cover 2 is in football, they can handle a team-points-per-player-drive metric. In fact, I think they’re thirsting for it.
It’s tough to break the mold of a traditional broadcast, but we’re getting there, and I think early adopters will be quite successful.
How does AutoStats link up with Stats Perform’s PressBox Graphics solution?
PressBox Graphics [PBG] is an incredible turnkey visualization tool that allows clients to set up templates for broadcast and social use. It is hooked up on the backend to automatically ingest our live or postgame data and is integrated into a customer’s image library.
 It turns sophisticated data-driven graphics creation into a process that takes seconds. As we began to think about AutoStats use cases outside the team-performance space, PBG was a natural fit as a way to show off the data in a way that grabbed people’s attention and fostered storytelling.
Historically, we delivered the data as a straight feed, which is a great way for a team of data analysts and scientists to build models but is not particularly engaging to anyone else. The value prop of PBG in and of itself is the same regardless of the data you’re referencing. But, with AutoStats, we thought the more differentiated the data was, the more impactful the graphics could be in driving a truly unique conversation.
In what ways can AutoStats integrate into a live broadcast?
One of our biggest successes last year was working with FIBA during their World Cup. We comprehensively covered every game in the tournament for them, collaborated on a number of custom templates via PBG, and complemented that with insights from our award-winning research team.
Essentially, we brought together coverage, visualization, and insights for a full-service package that was exceptionally well-received by the fans and the federation. The process was as simple as dropping a broadcast-optimized PNG file into a graphics engine. I remember the pride I had when seeing a graphic pop up during the Team USA ESPN telecast that I had created that morning — in about 30 seconds. And the pride continued to swell when the announcers took the data from that graphic and used it as a jumping-off point for their analysis.
The beauty of AutoStats is that we can do this for any school, team, league, or broadcaster, and we’re in discussions with a lot of them right now across different markets.
In what ways might this impact the coming conference-tournament period, as well as the NCAA Tournament?
When we got to the point of broadening the market beyond the team-performance space, the first thing we had to do was expand our coverage.
In the first few years of the product, we were laser-focused on pro prospects, so our coverage was generally centered on the Top 100 NBA Draft board. That was insightful for comparing players who fell under that description, but it would be challenging to create a product across college basketball if you had data on only a handful of players. Before this season tipped off, we proactively chose to expand our regular-season data set starting opening night, and we will comprehensively cover the men’s and women’s NCAA Tournament.
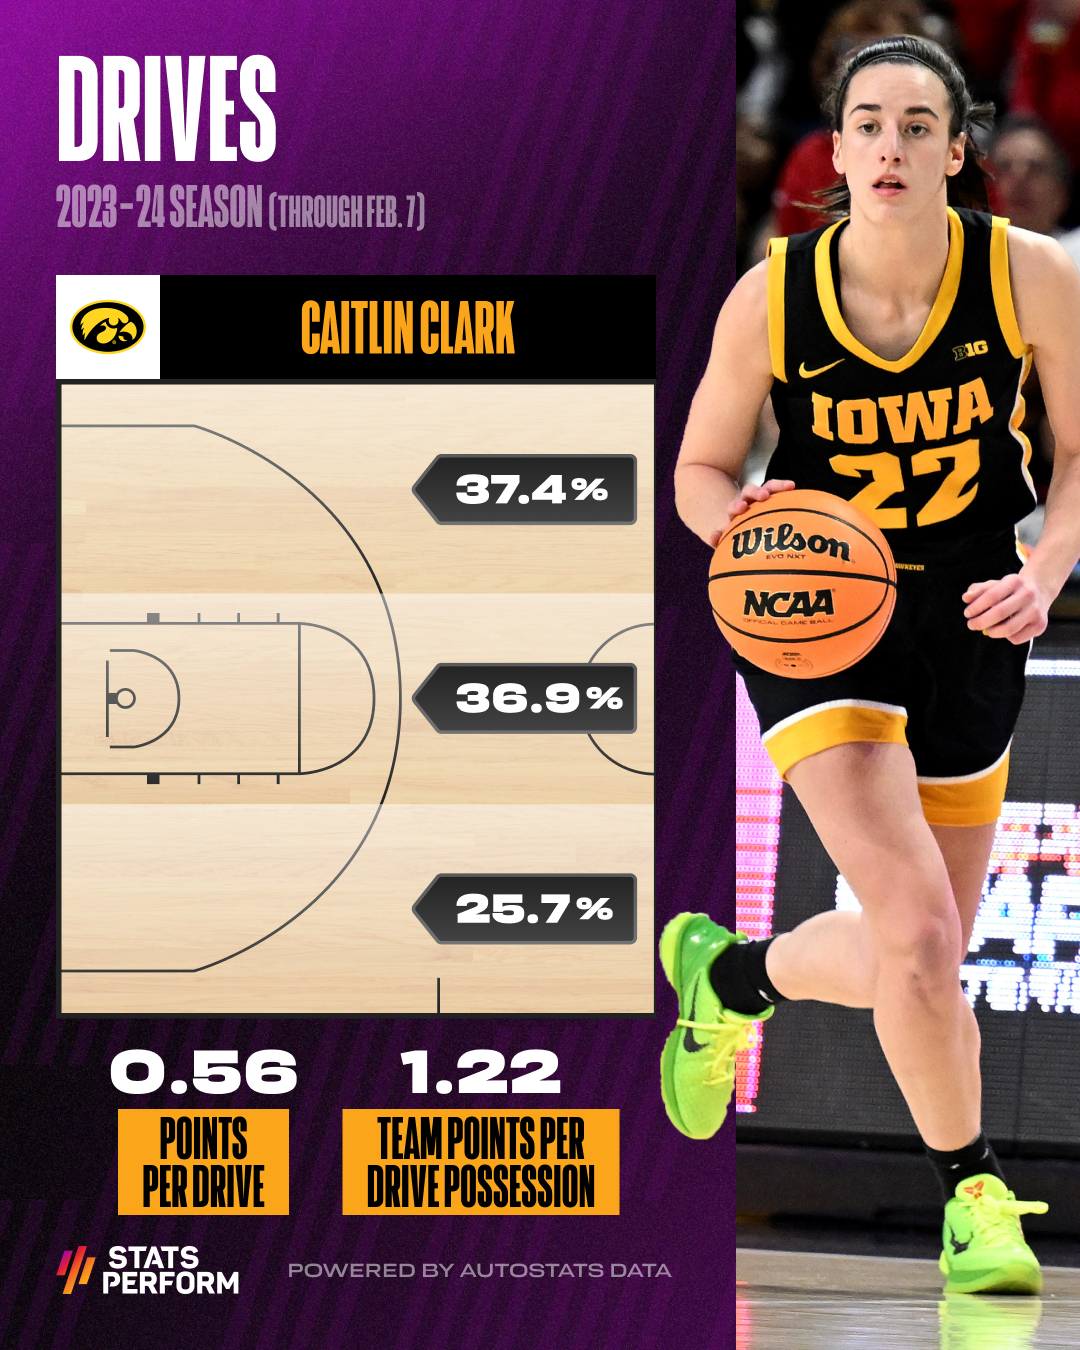
As part of the Caitlin Clark frenzy, we also chose to cover all of Iowa’s women’s basketball games and pushed out a number of AutoStats-based graphics via our own social networks to show how that data can effectively prop up the women’s game as well. Essentially, AutoStats has democratized basketball-tracking data regardless of gender or geography, given that its only requirement is video.
What’s next, in the short term, for this project?
Operationally, we’re at a pretty steady state, although there are always a few pipeline-optimization tasks we’re working on. The biggest effort is going to come from partnering with new teams, leagues, and broadcasters to gauge any requirements they have — whether they regard latency, coverage, data points, templates, feed structure, or integrations. We have a homegrown dashboard that visualizes our raw AutoStats outputs, and continuing to evolve that will be a point of emphasis on the roadmap.
Coming up with creative ways to visualize and contextualize advanced data to drive intuitive storytelling by leveraging design and editorial is always top of mind, as is ensuring that those solutions can be tailored across a broad swath of use cases, from broadcast to social to digital media to team performance.
In many ways, our mandate for tomorrow remains unchanged from five years ago: keep pushing the envelope in unlocking fan engagement and differentiated insights while advancing the conversation around basketball.